AIST6410 TechPrac04 Specs
20 pts - Practice with JSON & CSV
Ref: (Video) JSON & CSV Primer | JSON Overview | CSV Overview
JavaScript Object Notation (JSON)
Note: My intent with this exercise is for you to adjust the starting JSON by hand using Visual Studio as an editor which helps with JSON format. There are tools which convert XML to JSON and if you'd like to apply one to your existing CD library XML from TP03.IV to perform this task, that is fine by me (in fact, looking at the JSON, I'd probably never know.
Note: There are nascent specifications and approaches for JSON schemas (e.g., see json-schema.org) and style sheets (e.g., see XSLT equivalent for JSON) but they are not as well developed no as accessible as their counterparts for XML so this task does not include requirements for JSON schemas or style sheets, just formatting JSON data. Woohoo!
Add CDLib.json (this is the author's original XML CD library transformed as JSON) to the CDLibrary project in Visual Studio from TP03.IV. Adjust the data as we did in the earlier exercise to include a cdgenre and cdcomment for each CD and to add another CD of at least 3 tracks to the data. Leave this file in the the CDLibrary VS project folder in your Documents on the VM for grading.
Comma Separated Values (CSV)
Prepare a file named CDLib,csv which is a comma separated values version of the final data for the CD Library (author's original XML data with cdgenre and cdcomment fields added, plus a 3rd CD you've added). Place a copy of CDLib.csv in the CDLibrary folder in your Documents on the course VM (i.e., along with the other CDLib project files) for grading.
Hint: Use Excel to open an XML version of the data (without applying a style sheet, as an Excel table) and then save as comma separated values (i.e., a .csv file).
30 pts - Hands on intro to OLAP Cubes
Ref: (Video) NW Customer OLAP Cube | Video Notes | NWCustomerOLAP base query SQL | NWCustomerOLAP Build SQL
Recreate the Customer cube
Follow the guidance in the video and use the resources above to add the NWCustomerOLAP table to your copy of the Northwind database (i.e., {JagNetID}NW). Ensure that the Windows Server user group NWAnalysts has read (i.e., can select from) access to this table. Create an Excel file named NWCustomerOLAP.xlsx in your Documents folder on the VM which loads the table from SQL Server into a tab named NWCustomerOLAP. Nothing to upload to D2L, I can check your assets on the remote VM.
Build the Supplier cube
Using the NWSupplierOLAPBaseQuery as a starting point, create and save a SQL script which will build a table named NWSupplierOLAP in your copy of the Northwind database; save the build script as NWSupplierBuild.sql in your Documents folder on the course VM. Ensure that the Windows Server user group NWAnalysts has read (i.e., can select from) access to this table. Create an Excel file named NWSupplierOLAP.xlsx in your Documents folder on the VM which loads the table from SQL Server into a tab named NWSupplierOLAP. Nothing to upload to D2L, I can check your assets on the remote VM.
35 pts - Excel Pivot Tables 101
Prereq: Completion of the OLAP cubes from item II above.
Ref: (Video) Quick demo of Excel pivot tables & charts
Customer Analysis
Use your NWCustomerOLAP.xlsx spreadsheet to re-create the following analyses from the video on separate tabs, saving the resulting spreadsheet in your Documents folder on the course VM. Be sure to format values and headings as with the examples.
- A tab named CustomerShipments which provides a 'crosstab' of Customers (on rows) and Shippers (on columns) with a count of shipments and average gross value of shipments for the Customer & Shipper. For Example
- A tab named EmployeeSales which provides a chart and bar graph of gross and net sales for Employees. For Example
- A tab named DiscountsSummary which summarizes gross sales, discounts, and percent discount for Employees and Customers. For Example
Supplier Analysis
Use your NWSupplierOLAP.xlsx spreadsheet to create three 'interesting' analyses using pivot tables and / or charts. Put each analysis on a separate tab. In a row or rows at the top of the tab (above the analysis) describe a question the analysis could help answer and whether (and why) this question is (primarily) verification or discovery (using concepts from Watson Chapter 14, e.g., p. 281 of the pdf).
40 pts - Perform some data science
Prereq: Completion of the pivot tables from item III above.
Ref: (Video) Quick demo of Excel t-tests | Two sample t-tests in Excel
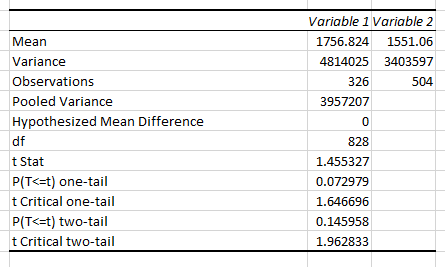
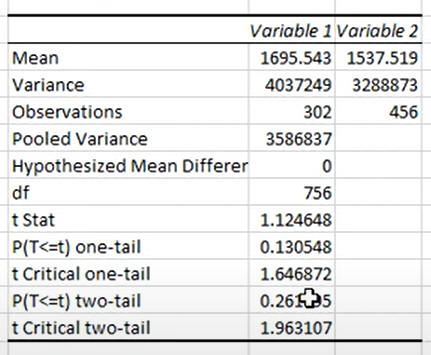
Addendum: In the video when I demonstrate the t-test for a difference in United Package's mean gross amounts from other shippers' mean gross amounts, I inadvertently still had a filter on EmployeeName from earlier practice so the analysis in the video didn't include all the records. If you try to repeat my analysis from the video, the image left below is the correct result, not the image on the right from the video. The overall conclusion -- no evidence of a difference in means -- is still correct. Kudos to Hunter Thomas for spotting this!


Customer Analysis
Use your NWCustomerOLAP.xlsx perform the following t-tests on differences in averages, saving the resulting spreadsheet in your Documents folder on the course VM.
- The video demonstrated how to test whether the average gross sales of shipments for the Shipper with largest average gross sales of shipments had a statistically significant difference from the average gross sales of shipments of the other shippers. On your tab named CustomerShipments to the right of your pivot analysis, perform a similar t-test of whether the average gross sales of shipments for the Shipper with the lowest average gross sales shipments has a statistically significant difference from the Shipper with the highest average gross sales shipments. Below the statistical analysis write your conclusion in words.
- The video demonstrated how to test whether the Employee with the highest overall discount percentage had a statistically significant different average discount amount than other employees. On your tab named DiscountsSummary to the right of your pivot analysis, perform a similar t-test of whether the Customer with the highest overall discount percentage had a statistically significant average discount amount than other customers. Below the statistical analysis write your conclusion in words.
Supplier Analysis
In your NWSupplierOLAP.xlsx spreadsheet, use two of the tabs to perform an 'interesting' t-test (so two t-tests total) of issues that occur to you while analyzing the data. Place the statistical results to the right of you pivot analyses and below the statistical analysis write your conclusion in words. Save the resulting spreadsheet in your Documents folder on the course VM.